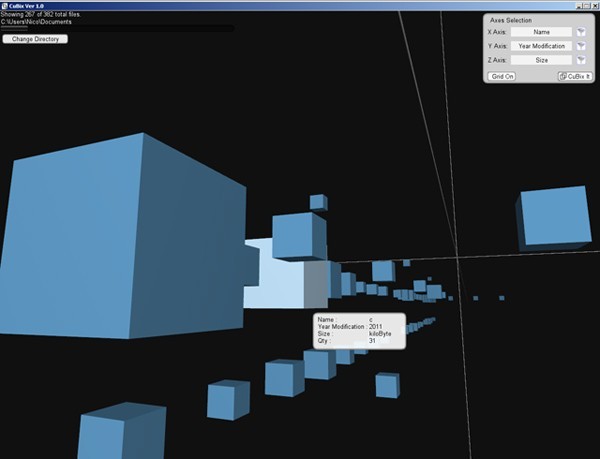
Axes
HatchKit v.2.7
Draw a pattern from scratch, open any existing pattern file or import DXF or HPGL files. Add or delete elements, zoom and pan, arrange repeats along any two axes, snap to a grid, add layers to form multi-spaced patterns, rescale,
EZplot for Excel v.1.01
EZplot is a plotting and data calculation computer software which enhances Excel. EZplot improves productivity by easily creating many plots in seconds. Plots are defined with parameter names instead of requiring manual selection of data.

Sensors Set v.0.8.0.0
"Sensors Set Ver.0.8" is for the developers to use the sensors in your Windows Phone application. ■Accelerometer (1) The values of acceleration on the X, Y, and Z axes. (2) The angles. (3) An object moves in a circle when you move your device.

Stereo Base v.1.0.0.0
A quick way to calculate the stereo base for taking 3D pictures with two cameras. The stereo base is the distance between the optical axes of the two cameras.
Nevron Chart for .NET v.2016.1
Nevron Chart for .NET is a professional charting component for .NET, featuring numerous business, scientific and financial charting types, gauges, VS design time support, AJAX support, built-in toolbar, flexible axes, and much more.
ScanIt v.2.0
Obtain data from images of graphs scanned from articles or available as image; define locations of the graph's axes, pick points, scan points or scan curves, copy the scanned data to Excel or save to file.
Nevron Gauge for SSRS v.2016.1
Nevron Gauge for SQL Server Reporting Services (SSRS) 2005/2008 is an advanced report item, which delivers a complete set of gauge types, highly customizable axes, tight data integration and unmatched visual effects to your reports.
ZigZag
Mathematical graphing tool for Windows. Features: Supported graph types: 1. Y(x); 2. X(y); 3. graphs of tables; 4. R(a) - in polar coordinates; 5. X(t) and Y(t) - parametrical equations; You can specify color, style and width
Xceed Chart for .NET
Create spectacular charts in your .NET applications with this high-quality yet cost-effective 2D/3D chart component. Features extensive VS.NET design-time support, built in toolbar and grid, built-in formulas, 3D view control and scene lighting, flexible
EcGraph
Powerful graphing ActiveX control that you can drop into your Visual Basic programs to create graphs in a huge range of styles. Great for scientific or technical graphs. You can get a graph up and running with just a few lines of code, and can manipulate